
Trading Idea: Indusind Bank
CMP: 1040
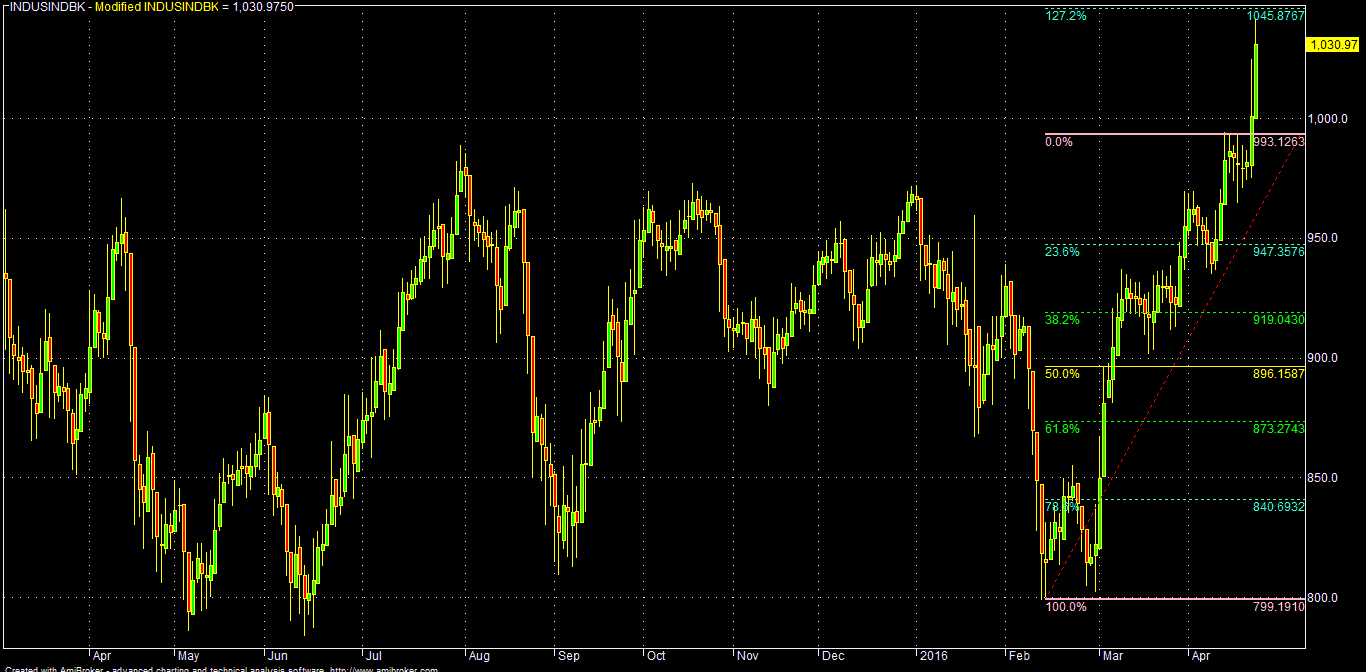
Either sell around 1045-1055 or on rise 1085-1100;
TGT: 994*-970-949-935*-895-855*-832-799* (1-3/6M)
TSL> 1110
Note: Consecutive closing (3 days) above 1110 zone for any reason, IIB may further rally up to 1150*-1200 & 1280 in the near to long term (alternative bullish case scenario).
Q4FY16 PAT of IIB printed at Rs.620.35 cr against consensus of 629.20 (YOY: 495.27; QOQ: 581.02).
Q4FY16 diluted EPS was at 10.33 against estimate of 10.47 (lagged by 1.35%). Previous median forecast of EPS was at 11.13 (YOY: 9.20; QOQ: 9.68).
In short Q4FY16 result of IIB was slightly below street estimate and provision also raised by 20.65% from Rs.177 cr to Rs.213.6 cr (QOQ). But, retail loan momentum is picking up and many analysts are banking up on it with 28% CAGR in EPS and giving a TP of around 1175 in 12 months.
For IIB:
Q4FY16 TTM EPS: 39.15 (FY16/Actual-Diluted)
Projected FWD EPS: 46.45-55.05-65.25 (FY:17-19/Estimated)
Average PE: 22
As par BG metrics and current market parameters:
Present median valuation of IIB may be around: 905 (FY:16/TTM)
Projected fair value might be around: 985-1075-1170 (FY:17-19/FWD)
| INDUSINDBK | EPS(TTM) | BV(Act) | P/E(AVG) | Low | High | Median | 200-DEMA | 10-DEMA |
| Q4FY16/TTM | 39.15 | 193.4 | 22 | 881.58 | 922.00 | 901.79 | 902.33 | 986.98 |
| FY17/FWD | 46.45 | 215.75 | 22 | 960.26 | 1004.29 | 982.27 | 902.33 | 986.98 |
| FY18/FWD | 55.05 | 240.55 | 22 | 1045.38 | 1093.31 | 1069.34 | 902.33 | 986.98 |
| FY19/FWD | 65.25 | 268.15 | 22 | 1138.11 | 1190.30 | 1164.20 | 902.33 | 986.98 |
Analytical Charts:


No comments:
Post a Comment