
For LHFL, Q4FY16 EPS Is 5.73% Below Estimate; But Overall Outlook May Be Improving.
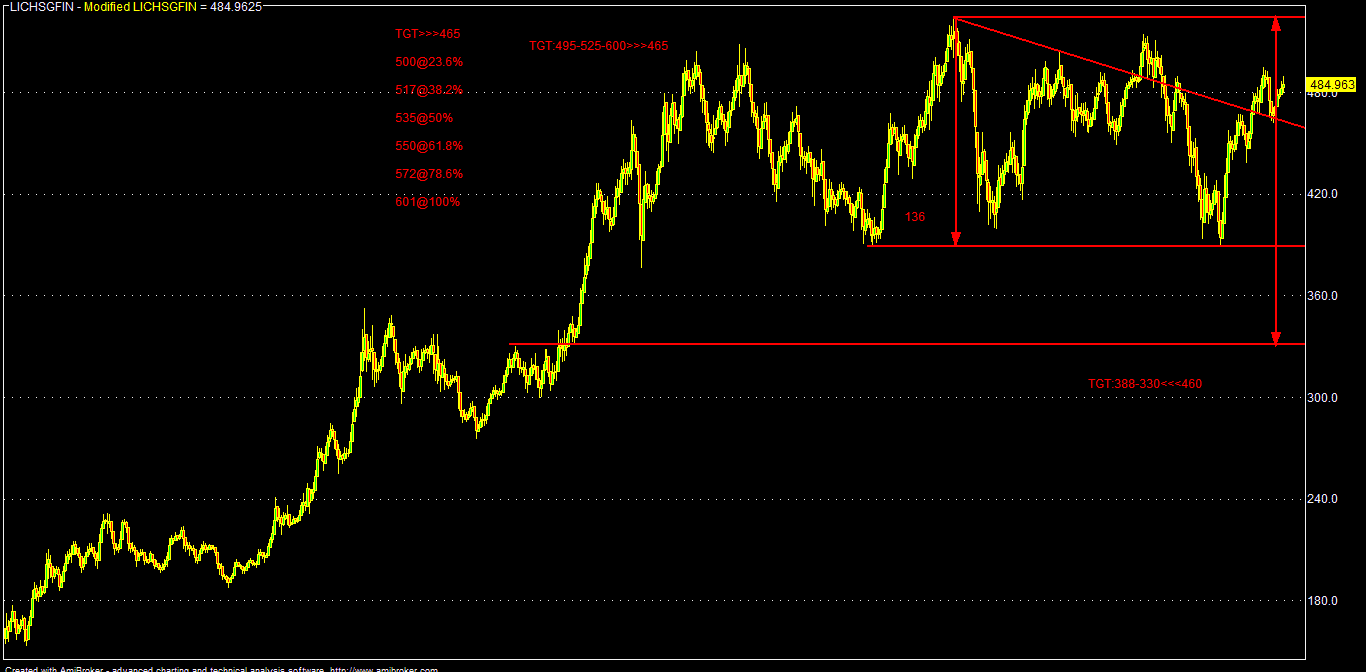
Technically, LHFL (CMP: 485) has to sustain over 495-505 for 515-525 zone and in the near term term, only consecutive closing above 525, it may target up to 565-585-610 territory.
On the flip side, inability to sustain over 495 zone, it may face selling pressure and consecutive closing below 475 area LHFL may fall towards 455-438-416 territory in the days ahead.
Trading Idea: LICHSGFIN
CMP: 485
Either sell below 495-505 or on rise around 515-525;
TGT: 475*-455-438-416*-402-385*-365-348 (1-3/6M)
TSL> 535
Note: Consecutive closing (3 days) above 535 for any reason, LHFL may further rally up to 552-565-585-610 & 635-660 zone in the near to long term (alternative bullish case scenario).
Q4FY16 result was below street estimates but improving outlooks and guidance can support the stock; i.e. it may be market performer in the days ahead until Q1/Q2FY17 results for further actual trend and management commentary.
Q4FY16 PAT was mainly impacted by higher tax (+25% YOY) and provisions (+264% YOY). Also, commission & brokerages expenses surged by around 48% (YOY) and 73% (QOQ) to 72.10 cr.
Q4FY16 results highlights & guidance (Qualitative):
OPM : 21.39%; grew by 1.08% (YOY) & 0.81% (QOQ)
NIM: 2.71%; grew by 9.72% (YOY) & 5.04% (QOQ)
Though operating margins are up by some extent, competitive pressure may be also visible. In recent times, LHFL mainly focused on high-yielding mortgage (LAP) and project loans to improve its spread (NIM).
Over the last few years, almost all banks & HFCS are trying hard to gain the secured mortgage loan markets and personal loans (specially backed by corporate salary account) amid tepid situation in corporate loan demands & related stressed assets (NPA). All the HFCS are beneficiaries to some extent to this trend and LHFL also grew its loan book by around 16% (QOQ) & 33% (YOY). Also there is visible improvement in project loan books (4% YOY & 65% QOQ).
At FY-16, LHFL loan book stood around Rs.125173 cr and 97% of this belongs to individual loan portfolios. In recent times, slowing loan books issues has some concerns amid slowing disbursements and higher pre-payment rates as many NBFCS and banks (private as well as PSBS) are increasingly targeting this housing loan markets, even in smaller towns as corporate loan demand for industries is not growing for various reasons.
Notably, 53% of loan books of the LHFL is at fixed interest rates and that may be quite helpful in the current/projected falling interest rate regime. But there must be some clauses and old borrowers may switch to flexible interest environment too !!
Also, less dependency on bank funding for LHFL helped it for better spreads (NIM). Q4FY16 cost of funds stand around 9.14% against 9.48% (YOY). LHFL's bank funding has reduced significantly from 32% in FY-12 to around 13% now in FY-16. New MCLR based funding from banks may also help it a bit.
Although Q4 provisioning surged by around 9% (QOQ) & 265% (YOY) amid growth in loan books, but gross NPA is stable around 0.45%. Probably, the management may try to explain it better at the time of Q4 concall (analysts meet). As par LHFL, they even provisioned for standard asset too in Q4.
Traditionally, HFCS taking more risks than banks by extending more credits to self employed professionals, business owners, who don't have a steady source of income (volatile income streams). So, HFCS also enjoyed better spreads than banks by lending at comparatively higher rates to these segment.
Although, increasing competition and falling rates may be some of the concerns in the quarters ahead for the sector, in case of LHFL, around 84% of the total loan book is highly secured by salaried class comfortable LTV (loan-to-value) ratio at 46.4% (against 50.9% YOY), the asset quality seems to be robust.
For the overall RE sector, there is a visible slowdown except some pockets across the boards, be it in cities or towns. The high value premium market is in a standstill as there are virtually no/negligible buyers. There are so much empty/unsold RE properties with high RE prices and builders are also sitting on huge debt, not willing to compromise/lower the price. Certainly, there are more existing supplies than demands & even more supplies are coming and this is quite visible now. Also, actual demand in metro cities is already saturated and very marginal home loan disbursement is happening now.
For LHFL slow down in core mortgage loan portfolio (10% YOY growth) and comparatively higher pre-payment rates may be some of the concern going forward.
Over the years, RE is India may also be one of the source for investment of black/unaccounted money and has some black political connections/finances too. This may be the one of the reason, that builders are not ready to compromise heavily on prices as they have to give its "investors" a "good" return and those "black investors" are also in no mood for early exit prom projects with peanuts return.
But now, with the proposed RE bill and its actual implementation, this "black money" equation may change in the coming years and we may see some slump in RE prices also as it may be very difficult to operate "unaccounted black money" in the RE sector.
This may be one of the concern for the RE sector and HFCS also. On the other side, RE-PE Fund (RETIS) may give some liquidity/deleverage support.
On the positive sides, expectations of higher economic growth supported by incremental employment and higher income, lower lending rates, normal timely monsoon with good distribution, actual implementation of 7PC/OROP and its expected effect on overall consumer spending (smart cities/affordable housing) may help RE sector and HFCS.
LHFL, being one of the trusted brand leader (backed by the LIC) is certainly a good portfolio stock for mid to long term and buy on dips around 415-400 may be a good idea (trading/investing strategy) in the current volatile market scenario and better risk reward ratio.
Q4FY16 results highlights (Quantitative):
EPS: 8.88 and below consensus of 9.42
PAT: 448 and below estimate 475.20
NII: 821.40 and below estimate 840
Spread/NIM%: 2.71 and above estimate 2.68
Provision: 37.63 and surged by 9.29% (QOQ) & 264.63% (YOY)
GNPA% : 0.45 and is at the same level YOY, but decreased by 2.17% (QOQ )
Q4FY16 result summary & consensus comparison:
| SCRIP | RESULT | ACTUAL | CONSENSUS | YOY | QOQ | SURPRISE | YOY | QOQ |
| LHFL | REVENUE | 3246.4 | NA | 2832.49 | 3139.22 | #VALUE! | 14.61% | 3.41% |
| (INR) | OP | 694.27 | NA | 575.29 | 646.02 | #VALUE! | 20.68% | 7.47% |
| OPM(%) | 21.39% | NA | 20.31% | 20.58% | #VALUE! | 1.08% | 0.81% | |
| PAT | 448.02 | 475.20 | 378.18 | 418.90 | -5.72% | 18.47% | 6.95% | |
| NPM(%) | 13.80% | #VALUE! | 13.35% | 13.34% | #VALUE! | 0.45% | 0.46% | |
| EPS | 8.88 | 9.42 | 7.50 | 8.30 | -5.73% | 18.40% | 6.99% | |
| INTEREST EARNED | 3205.66 | NA | 2800.21 | 3101.76 | #VALUE! | 14.48% | 3.35% | |
| INTEREST EXPENDED | 2384.26 | NA | 2150.38 | 2354.88 | #VALUE! | 10.88% | 1.25% | |
| NII | 821.40 | 840 | 649.83 | 746.88 | -2.21% | 26.40% | 9.98% | |
| NIM(%) | 2.71 | 2.68 | 2.47 | 2.58 | 1.12% | 9.72% | 5.04% | |
| PROVISION | 37.63 | NA | 10.32 | 34.43 | #VALUE! | 264.63% | 9.29% | |
| GNPA(%) | 0.45 | 0.45 | 0.46 | 0.58 | 0.00% | -2.17% | -22.41% | |
| TAX | 246.25 | NA | 197.11 | 227.12 | #VALUE! | 24.93% | 8.42% |
For LHFL (Standalone basis):
Q4FY16 TTM EPS: 32.91 (FY16/Actual)
Projected FWD EPS: 38.05 - 43.95 - 50.75 (FY:17-19)
Average PE: 15
FY15 actual EPS: 27.47; i.e. growth of around 19.8%
Average EPS for last five FY: 25.19
Average growth rate in EPS for last five years: 14.28%
Average growth rate in EPS for the last five quarters: 3.68%; i.e. 18.40% annualized
Projected EPS growth rate for next three years: 17.5% (15.5-19.5% at +/- 2%)
As par BG metrics and current market scenario:
Current median valuation of LHFL may be around: 480 (FY:16/TTM)
Projected fair value might be around: 520-555-600 (FY:17-19/FWD)
| LICHSGFIN | EPS(TTM) | BV(Act) | P/E(AVG) | Low | High | Median | 200-DEMA | 10-DEMA |
| Q4FY16/TTM | 32.91 | 154.92 | 15 | 474.51 | 485.78 | 480.15 | 456.11 | 478.04 |
| FY17/FWD | 38.05 | 171.25 | 15 | 510.22 | 522.34 | 516.28 | 456.11 | 478.04 |
| FY18/FWD | 43.95 | 189.25 | 15 | 548.35 | 561.38 | 554.87 | 456.11 | 478.04 |
| FY19/FWD | 50.75 | 210.1 | 15 | 589.25 | 603.25 | 596.25 | 456.11 | 478.04 |
Analytical Charts:


No comments:
Post a Comment