
230-224 might be a very good demand zone amid market volatility
Q2FY16 result beats the street in nearly all analytical metrics
CMP: 243
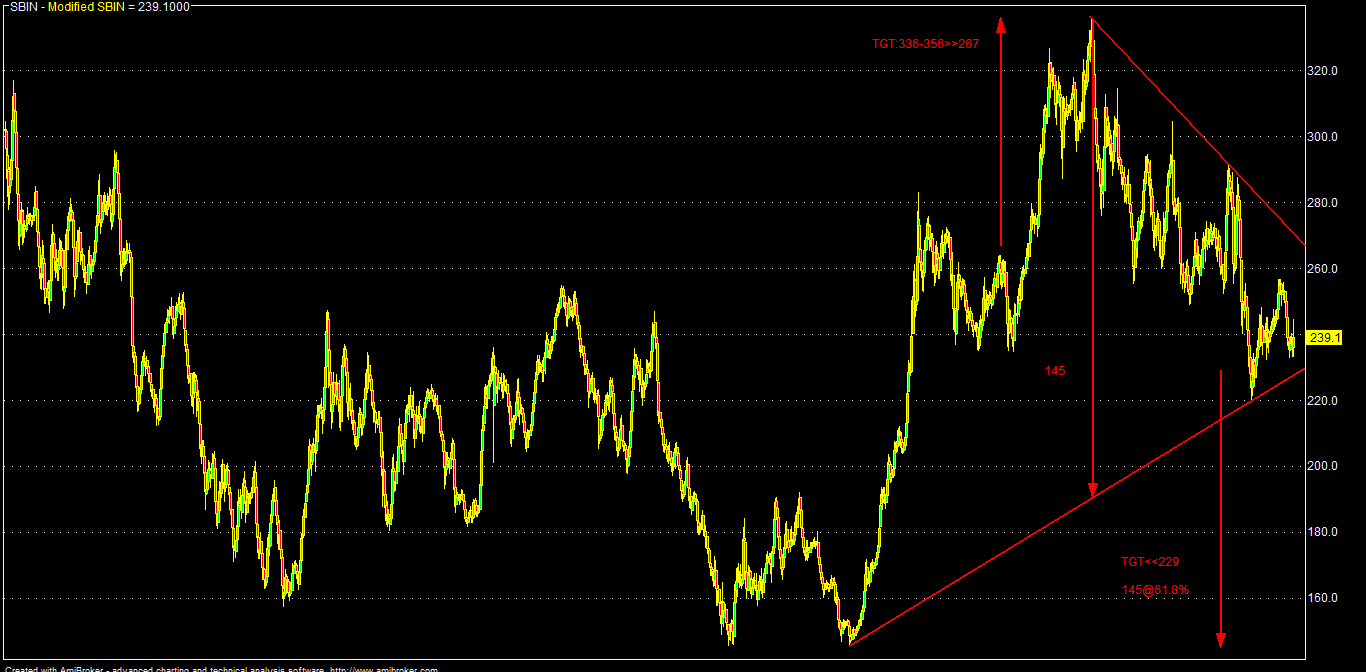
Buy either on break out above 248-250 or wait for dips around 230-224-220:
TGT: 260-270-295 (1-3M)
TGT: 315-335-355 (12-24M)
TSL< 215
Note:
Consecutive closing below 215 for any reason, SBI can fall up to
205-192 & 170-140 zone, where it can be again accumulated for better
investment buying average.
Q2FY16 result was above market estimates along with declining trend of stressed assets.
| RESULT | ACTUAL | CONSENSUS | YOY | QOQ | CON(%) | YOY(%) | QOQ(%) |
| PAT | 3879.07 | 3581.00 | 3100.41 | 3692.43 | 8.32 | 25.11 | 5.05 |
| EPS | 5.08 | 4.96 | 4.15 | 4.88 | 2.42 | 22.41 | 4.10 |
| NII | 14252.00 | 14099.00 | 13724.60 | NA | 1.09 | 3.84 | NA |
For
SBI, 25% surge in Q2 PAT (YOY) was aided by other income, operating
profit and low provisions. But higher tax cost (up by over 93%) affected
the bottom line to some extent.
NII
was also above analyst's expectations. Other income also surged by over
35% amid forex gain and repatriation of funds (profits) from foreign
offices.
There
is visible improvement in asset quality and net NPA fall to 2.14% in
Q2FY16 against 2.24% sequentially and 2.73% YOY (as a percentage of net
advances).
Also corporate loan growth in Q2 was above industry average for SBI.
Provisions & fresh slippages also declined both sequentially and yearly by some bps.
Analysts are expecting to maintain the NIM
in the upcoming quarters. High CASA (cheaper deposits) and fee income is
the core strength of SBI.
SBI
management is also very confident about the NPA management and
optimistic about improvement in recovery, assets quality through various
proactive strategy of the bank in close conjunction with the borrowers.
The bank is committed not to allow further
rise in NPA in FY-16. The bank's gross NPA stood at around Rs.56275 cr
at Q4FY15 representing 4.2% of total advances.
Management of SBI sees current stress in
SME & mid-corporate loan accounts due to various legacy policy &
some sector specific issues and expecting that the situation will be
better with improvement in the overall macros, rise in Govt spending
etc.
But, due to highly leveraged corporate
balance sheet and slow economic recovery (its going to be an U, not a
V), a meaningful sequential reduction of stressed assets will take time
and it will be gradual.
Also there is continuing slippages from
restructured loan portfolio as companies are unable to improve their
performances despite relaxed repayment terms offered by the banks. Thus
we may see some more pains from core sectors (power & metals borrowers)
for both public & private banks.
Presently there is around Rs.2.65 lac
crores in stressed assets - CDR mechanism in our banking system. The
fate of such restructured loans will depend on the visible real economic
recovery and resumption of various stalled projects, which will improve
the cash flow and repayment ability of the corporate borrowers.
But despite the above apprehensions, it seems that PSBS are in control over its NPA cycle now and there
is a visible downtrend in their Q2FY16 result , although its may be too
early to came to a definite conclusion as Q4FY15 excess provision issue
was also there.
We
may also see some consolidation (M&A) in the PSBS space in the days
ahead as it may not be viable for the Govt to run 27 PSBS.
Power reforms initiative is also positive for PSBS and SBI may be one of the beneficiary also.
Looking ahead, subsidiary (insurance/housing arms etc) deleveraging may also be a trigger for SBI.
SBI
is also corrected over 32% from its late Jan'15 peak due to various
reasons like NPA, equity dilution etc.
Now, technically, 230-224-220
zone is a strong support and accumulation from this zone may be good as
risk reward ratio is quite favorable.
As par BG metrics & current market parameters:
(on standalone TTM & FWD EPS basis)
Present median valuation of SBI may be around: 240 (FY:15/TTM)
Projected fair valuations might be around: 255-285-315 (FY:16-18/FWD)
| SCRIP | EPS(TTM) | BV(Act) | P/E(AVG) | Low | High | Median | 200-DEMA | 10-DEMA |
| SBIN | 18.87 | 169.77 | 12 | 242.65 | 233.45 | 238.05 | 260.01 | 240.68 |
| SBIN | 21.25 | 187.5 | 12 | 257.49 | 247.74 | 252.61 | 260.01 | 240.68 |
| SBIN | 26.75 | 207.25 | 12 | 288.90 | 277.95 | 283.43 | 260.01 | 240.68 |
| SBIN | 32.35 | 228.25 | 12 | 317.70 | 305.67 | 311.69 | 260.01 | 240.68 |
Analytical Charts:


No comments:
Post a Comment