Thursday, 31 March 2016

Axis Bank: Need To Stay Above 450-470 Zone For More Rally

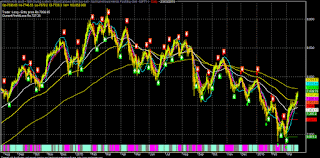
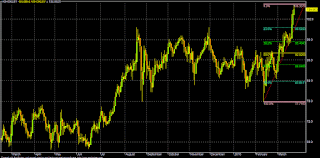
Technically, Axis Bank has to sustain above 450-470 zone for more rally up to 490-535 zone; otherwise it may face selling pressure and sustain below 437-427 may again fall up to 411-374 area in the near term.

Trading Idea: Axis Bank

CMP: 444

Either sell below 450-460 or in rise around 470-490;

TGT1: 427-411*-405-387-374-365* (1-3/6M)

TGT2: 348-325*-310-290*-275-265 (12M)

TSL>500

Note: Consecutive closing (3 days) above 500 for any reason, Axis Bank may further rally up to 520-535* & 570-625*-655 in the near to long term (alternative bullish case scenario from the current trading level).

Although there may be no disclosure issue about Q4FY16 asset quality issues this time (stressed assets provisions-RBI- AQR), some analysts are expecting incremental higher provision and consequent higher credit costs by around 20-25%.

For Axis Bank:

Q3FY16 TTM EPS: 34.49

Projected FWD EPS: 34.65-40.50-46.75 (FY:16-18)

Average PE: 15

As par BG metrics & current market scenario:

Present median valuation may be around: 480 (Q4FY16/TTM)

Projected fair valuations might be around: 481-520-560 (FY:16-18/FWD)


SCRIP EPS(TTM) BV(Act)  P/E(AVG) Low High Median  200-DEMA 10-DEMA
AXISBANK 34.49 187.54 15 486.93 471.92 479.43 458.3 430.48

AXISBANK 34.65 217.75 15 488.06 473.01 480.54 458.3 430.48

AXISBANK 40.5 252.55 15 527.65 511.39 519.52 458.3 430.48

AXISBANK 46.75 295.75 15 566.91 549.43 558.17 458.3 430.48


Analytical Charts:


Wednesday, 30 March 2016

Cipla: 490-460 May Be A Very Good Demand Zone--Are US FDA Issues Peaking ?

Price & time action on the technical chart suggests that Cipla has very good support around 490-480-460 zone and sustaining above 495-505, it mat target 530-555 in the near term.

On the flip side, consecutive closing below 460, it may further fall up to 405-365 in the worst case scenario.


Trading Idea: Cipla

CMP: 503

Either buy above 495 or in dips around 480-470;

TGT: 530-555*-582-605*-630-660 (1-3-6 M)

TSL< 460

Note: Consecutive closing (3 days) below 460 for any reason, Cipla may further fall towards 430-415-405*-380-365* in the near to mid term (alternative bear case scenario from the current trading level).


In the last few months several plants of Indian pharma cos (DRL/Lupin/Cipla/Sun/Cadila/Natco) has come under US FDA scanner. It seems that Indian pharma cos are increasingly making themselves as "soft targets" of US FDA and even drug regulators of other countries, such as UK are targeting them.

Apart from quality, raw material, GMP, the main issues are involved here is data integrity and going forward, its highly expected that pharma cos will get their act together and resolve these recurring issues.

There may also be a political angle to it, specially in the US election year (from affordable quality drugs, local employment to political donation). Thus, if Indian pharma cos will able to resolve these US FDA issues by being more serious about US quality standard and data integrity, the current US FDA fiasco may be termed as "peaking". 

For Cipla (Consolidated):

Current Q3FY16 TTM EPS: 20.99

Projected FWD EPS: 23.00-26.75-30.45 (FY:16-18)

Average PE: 20 (Current PE around 25 against industry average 30)

As par BG metrics & current market scenario:

Present median valuation may be around: 490 (Q3FY16/TTM)

Projected fair valuations might be around: 515-555-590 (FY:16-18/FWD)


SCRIP EPS(TTM) BV(Act)  P/E(AVG) Low High Median  200-DEMA 10-DEMA
CIPLA 20.99 134.19 20 504.83 470.63 487.73 607.08 527.62

CIPLA 23 148.35 20 528.45 492.65 510.55 607.08

CIPLA 26.75 163.95 20 569.90 531.30 550.60 607.08

CIPLA 30.45 181.25 20 608.04 566.85 587.45 607.08 527.62


As par DCF/EV method, current valuation of Cipla may be around 710 and projected (FY:17) value may be around 850.

EV NET DEBT EV TO EQ NO OF EQ SHARES O/S PROJ.FAIR VALUE

58403.65 1701.76 56701.89 802960440.00 706.16

70084.38 2382.50 67701.88 802960440.00 843.15

Analytical Charts:


Tuesday, 29 March 2016

Bank Nifty Fut (March):16000-16150 May Be A Big Hurdle, Even If RBI Cut By 0.50%

Looking at the chart, BNF has to sustain above 16000-16150 for 16350-16450*-16925-17150 area; otherwise, it may face selling pressure and sustain below 15800-15500, it may again fall towards 15225-14800 zone in the near future.

Trading Idea:BNF-MARCH

CMP: 15725

Sell either below 15800 or on rise around 16000-16100;

TGT: 15500-15355-15225*-15100-14995-14820-14615-14550 (1-5 days)

TSL> 16150

TSL/ALL other levels (+/-) 50 points

Note: Consecutive closing (3 days) above 16150 for any reason, BNF may further rally up to 16350-16450*-16925-17150 in the near term (alternative bullish case scenario from the current trading level).

BNF made a smart rally of above 19% (2600 points) from the budget day low of around 13405 to the recent high of 16005 in the last few weeks primarily on the back of rate cut hopes by RBI on 5-th April'16.

Although rate cut of 0.25% is almost certain, going by the recent deposit rate cuts in various small savings instruments by the Govt, this time RBI may cut by 0.50% and the recent time & price action may be indicating that rate cut of 0.50% is almost discounted.

There are mainly two scenarios for the forthcoming RBI cut:

1. RBI cut by 0.25% in April and keeps a cautious/hawkish tone about monsoon/inflation etc and indicate that it will be accomodative for another rate cut of 0.25% in August'16. BNF may crash heavily under this scenario as it is already discounted rate cut by 0.50%.

2. RBI cut by full 0.50% in April'16, indicating that the rate cut cycle may be over in the near term (FY:17) and throw the ball to the Govt for inflation (CPI) below 5% and structural/policy reform. RBI may also emphasis on the rate cut transmission issues by the banks and management of NPA. In this scenario, BNF may show a whipsaw movement by jumping instant 100-200 points and then again fall (buy on rumour and sell on news).

Market may also look into any liquidity enhancing measure by the RBI, such as CRR/SLR/MSF rate cut/tweaking as Indian Banking system, specially PSBS are under severe stress.

Looking forward, as par various reports, total stressed assets may reach around Rs.8 lakh cr in FY-16 and by FY-17, it may reach around Rs.11-15 lakh cr (around 15% of gross advances by banks). The huge provisioning along with incremental credit costs and subdued fresh credit growth may keep the bottom line of the PSBS under huge stress in the coming quarters.

Now, all will depend upon the standardization, recovery of the stressed assets and unless there is visible uptick in overall economic/industrial recovery, the current NPA mess may not improve much and more over, we may see fresh addition of NPA(s) in the coming years.

As cost of doing business in India is quite high comparable to other advance economics and unless real rate of interest for borrowing needs of corporates/MSME reduced to an appropriate level by structural reform, the present condition of stress assets may continue. In India, average borrowing rate for business may be between 10-12% and thus the RRR for industry/MSME may be around 5-7% (assuming average CPI around 5%), which is very high and primarily responsible for the present state of stressed assets apart from business management and demand supply dynamics.

Overall state of the current situation in PSBS may be termed as a "Mini Banking Crisis" in India and the Govt's recapitalization effort may be too little and too late !! 

Analytical Charts:


Monday, 28 March 2016

Nifty Fut(Mar): Rallied More Than 13% In The Last 30 days---What's Next ?

Technically, NF need to sustain above 7760-7825 zone for further rally up to 7915-8005; otherwise we may see some selling pressure and sustain below 7672-7632 it may fall towards 7560-7415 zone again.

Trading Idea: Nifty Fut (Mar)

SGX-NF: 7690 (LTP)

NSE-NF: 7728

Either sell below 7710-7760 or on rise around 7800-7825;

TGT: 7672-7632*-7560-7485-7415*-7365-7300-7240 (1-5 days)

TSL> 7860


Note: Consecutive closing (3 days) above 7860 for any reason, NF may further rally up to 7915-8005 & 8055-8100 zone in the near term (alternative bullish case scenario from the present trading level).

NF made a smart rally of more than 900 points (13%) from the budget day low  in a  span of less than 30 trading days. As the budget delivered not so much negativity as feared by the market ( specially  no change in LTCGT and service tax), market recovered on the back of massive short covering/some value buying. Global market (SPF) also recovered by more than 13% from the Feb'16 low after G-20 meeting and some apparent co-ordinated action by 4 major central bankers of the world (PBOC/BOJ/ECB/Fed) in the last few weeks.

Fed was more than dovish than the market expected and FFR is now basically indicating only 1 rate hike probability in Dec'16. But, in the last week, after series of Fed speakers (drama), USD gained some strength as talk of April "live meeting" or June hike possibility again resurfaced. Also, Fed transcript of press conference after March Fed meet is causing some confusion regarding the possibility of every meeting being "live or dead" !!

Last Friday's data of US GDP (Q4 revision) was at 1.4% against expectation of 1%. Though this GDP is pointing towards no apparent recession in US as feared by the market, but falling corporate profitability (core) may be a concern. 

Apart from China, Oil, Brexit, possibility of Trump being the next US president may be a major headwind for the "risk on" rally as USD will gain more strength.

Thus Fed may wait till outcome of US election for its next step and in that scenario, Dec'16 may be an ideal time.

Back home, after budget 2016 projected a fiscal deficit of 3.5%, market has already discounted 0.50% rate cut by RBI on 5-th Apr'16. So, even if RBI cut by 0.50%, the repo rate will be 6.25% and the RRR will be around 1.25% (Avg CPI 5%), which may be in the lower range of comfort zone for RBI (preferred range of RRR 1.5-2%). In that scenario, market will take that rate cut cycle is over in the near term and will focus again on the fundamentals ( deteriorating corporate earnings and huge NPA of PSBS; i.e. twin balance sheet issues of India) and we may see selling/long unwinding.

Market will also watch forthcoming state elections & BJP's prospect there along with Govt's ability to pass the GST & other important reform bills in the RS. But, going by the present political situation and falling popularity of NAMO, it may looks tough.

Analytical Charts:


Friday, 25 March 2016

Ashok Leyland: At Around 35 PE, The Stock May Be Expensive Despite Lockheed Deals !!

Technically, ASL has to sustain above 108-115 zone for target of 122-125 & 135 area; otherwise it will face selling pressure and sustain below 105-98 zone, may again fall towards 90-84-77 territory.

Incremental benefit of demands from replacement market & regulatory requirements for MHCV segment may be limited in the days ahead and will depend up on the actual recovery in capex and investment cycle in India.

Trading Idea: Ashok Leyland

CMP: 106

Either sell below 108 or on rise around 112-115-122;

TGT: 98-95*-90-84*-77-65 (1-3/6M)

TSL> 125

Note: Consecutive closing (3 days) above 125 for any reason, ASL may further rally up to 135 in the near term.

ASL made a life time high of around 106 yesterday and moreover rallied around 36% from Mid-Feb'16 low of 78.

Apart from the budget & G-4 (Fed/ECB/BOJ/PBOC) induced general market rally for the last few weeks, some of the reasons for the massive 36% rally in  ASL may be attributed to:

Over 50% & 75% increase in investments in road construction and defense MHCV in the 2016 budget is positive for MHCV makers including ASL. The change in MV act along with scrapping of permit systems & old vehicles replacement incentives are also positive for the sector as this may increase the demand by 10-15%.

Significant growth in MHCV segment (both truck & buses), which account around 80% for ASL top line and it commands a market share of around 32%. Also ASL doing well in LCV segment and analysts are expecting a 10% CAGR for the segment on the back of lower/stable diesel prices and increase interests/profitability of fleet operators/logistics. 

But analysts are also attributing to the fact that most of the demands for trucks are coming from replacement market because of old age vehicle issues (NGT), specially from NCR regions, where 15 years old trucks are banned. So, once this demand of replacement markets get exhausted, we may not see the incremental growth of 25-35%  (on YOY basis), specially in the absence of any visible economic/industrial recovery in the near future. 

The same factor (replacement demands and regulatory changes) is partially true for the buses also. 

In MHCV, H2FY16 volume growth of ASL is around 78% against industry growth of  44%. The strong volume & OPM growth was also attributed to price increase owing to regulatory requirement (like ABS, Speed Control Device, BS-IV compliant vehicles).

But going forward, incremental growth in sales for these regulatory requirements may come towards a saturation point and there may not be the benefit of lower base effect in the coming quarters. 

Also there will be intense & growing competition from Bharat-Benz, Volvo-Eicher, MTBL (M&M) apart from Tata Motors. So Q2FY16 EBITDA of 10% will be difficult to maintain and benefit of incremental lower input costs (commodity raw materials) may also be not there. Q3FY16 EBITDA margin was around 7.8% although it was around 4.1% YOY. Despite 1.5% price hike in Q2, product discount may be continue to be higher in the range of 2-2.5 lacs/unit.

Thus looking ahead, incremental earnings growth of ASL may be limited despite the management's focus on R&D (new product development), network expansion (both domestic & international market), cost cutting and domestic growth led by replacement/regulatory & mining/infra sector demand and MHCV Bus orders under STU/JNNURM schemes.

Apart from the MHCV segment, ASL management is also relying on export and defense as another major growth driver and projected around 33%  of revenue from these sector in the medium term.

Infact, ASL/ALDS is the largest provider of logistics vehicles for the Indian Army (IA) and also has a strong portfolio in the defense sector.

Recently it signed an agreement with US based Lockheed Martin (LM) to develop light combat vehicles for the IA and make India a manufacturing & export hub for the Light Specialist Vehicle (LSV) and Light Armoured Multipurpose Vehicle (LAM) of "high quality in a cost effective way" using the platform of LM's high mobility vehicle or Common Vehicle Next Generation (CVNG).  

The IA does not have such LAM/LSV at present and now using primarily a heavy vehicle (Stallion, which is also made by ALDS) for all purposes. IA was planning to add these light vehicles for the last 7-8 years and finally the tender came in last year for 1300 LSV and 700 LAM (s) worth about $1 bln (first time order) and winner of this contract, will have the opportunity to supply the IA for the next 15-20 years. ALDS is expecting that with the proven technology of LM at Indian cost (low) with localization & required modification (as par Indian requirement), it will be able to win this IA light vehicles contract.

But, there will be intense competition among the defense players for this IA tender and even if ALDS can procure the full contracts of the LSV/LAM (s), its effect on the net earnings (bottom line) may be reflected only after 3-5 years later.

Looking ahead, the projected defense spending and DPP using "Make In India" theme may also depend upon the Govt's fiscal plan or capex ability and the market may like to see it in reality.

Another point is that "defense" is a sensitive & political issue for many advanced nations and they will not compromise any quality for the sake of some cost cutting. There is a virtual monopoly for US, Russian companies in the global defense market and Israel, France are also strong players. 

Any country may think twice before buying sophisticated defense parts having "Made In China" or "Made In India" tag.  So, any significant defense exports from India may take considerable time for a visible impact in the bottom line of the defense companies here.

ASL is also in the process of terminating JV agreement with John Deere (construction equipment) and Nissan (CV/Power Trains/Technology), which may have some negative implications for the ASL in future. 

Considering all the above positive news flows for the ASL and its recent price action, the scrip may be largely discounted and now technically may be in a good supply zone.

For ASL:

Actual TTM EPS: 3.08

Projected FWD EPS: 3.60-4.40-5.20 (FY:16-18)

Average PE: 25

As par BG metrics & current market scenario:

Present median valuation may be around: 85 (FY:15/TTM)

Projected fair valuations might be around: 90-100-110 (FY:16-18/FWD)


SCRIP EPS(TTM) BV(Act)  P/E(AVG) Low High Median  200-DEMA 10-DEMA
ASHOKLEY 3.08 14.4 25 81.03 87.27 84.15 85.28 98.9

ASHOKLEY 3.6 16.95 25 87.61 94.35 90.98 85.28 98.9

ASHOKLEY 4.4 20.05 25 96.85 104.30 100.58 85.28 98.9

ASHOKLEY 5.2 25.05 25 105.29 113.39 109.34 85.28 98.9


Analytical Charts: