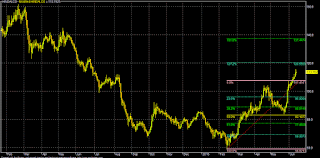
Trading Idea: Hindalco
CMP: 115
Either sell around 118-123 OR on rise around 130-135
TGT: 109*-105-100-95-90-82*-67-58*-50-38 (1-3/6M)
TSL> 125 OR >140
Note: Consecutive closing (3 days) above 140 for any reason, Hindalco may further rally up to 150*-158-166-177 & 192-200 in the near to long term (alternative bullish case scenario)
For Hindalco: Standalone Basis
Q4FY16 TTM EPS: 2.94 (FY-16/Actual)
Projected FWD EPS: 3.45-3.95-4.55 (FY:17-19/Estimated)
Average PE: 25
As par BG metrics and current market volatility:
Present median valuation may be around: 85 (FY:16/TTM)
Projected fair valuation might be around: 95-100-106 (FY:17-19/FWD)
Analytical Charts:
CMP: 115
Either sell around 118-123 OR on rise around 130-135
TGT: 109*-105-100-95-90-82*-67-58*-50-38 (1-3/6M)
TSL> 125 OR >140
Note: Consecutive closing (3 days) above 140 for any reason, Hindalco may further rally up to 150*-158-166-177 & 192-200 in the near to long term (alternative bullish case scenario)
For Hindalco: Standalone Basis
Q4FY16 TTM EPS: 2.94 (FY-16/Actual)
Projected FWD EPS: 3.45-3.95-4.55 (FY:17-19/Estimated)
Average PE: 25
As par BG metrics and current market volatility:
Present median valuation may be around: 85 (FY:16/TTM)
Projected fair valuation might be around: 95-100-106 (FY:17-19/FWD)
| HINDALCO | EPS | BV | P/E | Low | High | Median | 200-DEMA | 10-DEMA |
| Q4FY16/TTM | 2.94 | 183.35 | 25 | 82.20 | 88.85 | 85.52 | 91.92 | 107.41 |
| FY17/FWD | 3.45 | 193.5 | 25 | 89.04 | 96.25 | 92.65 | 91.92 | 107.41 |
| FY18/FWD | 3.95 | 204.25 | 25 | 95.27 | 102.99 | 99.13 | 91.92 | 107.41 |
| FY19/FWD | 4.55 | 215.35 | 25 | 102.25 | 110.53 | 106.39 | 91.92 | 107.41 |
Analytical Charts:


No comments:
Post a Comment