
Trump
rally may be too fast and much ahead of reality; US market may correct in
Jan’17.
Trade
protection & higher fiscal spending rhetoric by Trump may cause significant
upper trajectory in US inflation and subsequent stronger USD may also result
into a significant earnings erosions for US corporates, despite perception of
“Trumponomics” (higher spending, lower tax, higher corporate profits and higher
job creations; higher inflation & higher growth).
2017
may be a year of some serious geo-political risks not only for EU, but may also
be for US itself (an unpredictive and politically inexperienced President with
a cabinet or main advisors, some of whom may have conflicts of interests
because of their own business empire and a known China hawk).
Global Mantra Part-II:
24/12/2016 (11:30)
SPX-500 Fut: 2259 (LTP)
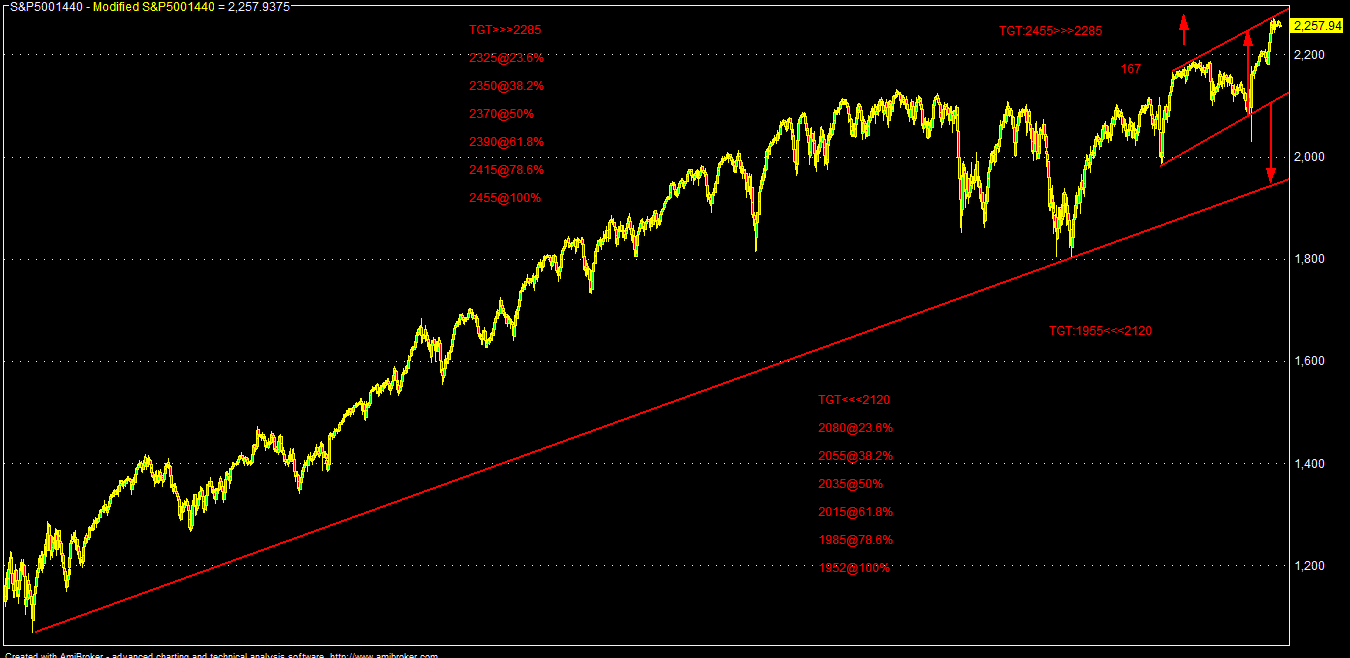
Technically,
SPX has to sustain over 2285-2305 area for any further rally towards 2315-2350
& 2390-2420 and 2455-2510 zone in 2017; i.e. it may have further upside of
around 8-10% from its recent high of around 2273 (under bullish case scenario).
On
the down side, sustaining below 2275-2255 area, SPX may further fall towards
2240-2210 & 2190-2165 and 2140-2120 zone in the near term (3-6 months);
i.e. it may correct by around 5-7% from its recent high of around 2272 (under
bear case scenario).
DJI-30 Fut: 19859 (LTP)
Down
Jones Fut (DJ-30) has to sustain over 20100-20250 area for any further rally
towards 20450-20750-20900 & 21150-21400-21800 and 22250-24150 zone in 2017;
i.e. it may have further upside of around 12-20% from its recent high of 19917
in the bullish case scenario.
On
the down side, sustaining below 19975-19825 area, DJ-30 may further fall
towards 19700-19400-19000 & 18750-18550-18295 and 17750-17400 zone in the
near term (3-6 months); i.e. DJ-30 may correct by around 10-13% in the bear
case scenario.
In
2016, SPX rallied by around 11.5% & 26% from the Feb’16 low and more over
12% alone from “Trumpism Day” low. Similarly, DJ-30 rallied by over 14% from
“Trump day” (9th Nov) low on the back of relentless rally after
initial “epic fall” as “President” Trump sounds different against earlier
election rhetoric of “Candidate” Trump. His carefully crafted election victory
speech that “We will rebuild America” and conciliatory approach towards the
losing candidate Clinton made all the previous assumptions awfully wrong for a
prolonged “dooms day” scenario, in case of an “unexpected” win by Trump.
Thus,
its hope of “Trumponomics”; i.e. higher fiscal spending to the tune of $1 TLN
in next 10 years (?), big corporate & personal tax rate cuts, reduced
regulations which is propelling the US market. Eventually, as a result of
“Trumponomics”, US growth & inflation and employment may gather momentum
and subsequently, corporate earnings may be also getting some incremental
growth.
As
par some analysis, original tax & budget plan of Trump may have cost US
Federal debt by around $11.5 TLN over next 10 years; but after modification
done by his “main stream economists” team, it might cost US debt by around $5.3
TLN.
Now,
all will depend upon the actual “budget plan” and future “vision plan” by Trump
& his team after taking charge of Oval office on 20th Jan’17. In
reality, it may take significant longer time for necessary negotiations within
the US Congress, its ultimate passage and actual implementation; size of the
overall fiscal spending may also be reduced by the US Congress; otherwise it
will cause huge budget hole and US has to take more debt to fund its fiscal
deficit.
It’s
precisely the perception of more supply of US debts/TSY Bonds, which is
propelling the US bond yields & USD to a record high, apart from another
primary reason of USTSY bond sales by China & some private investors.
But,
ultimately the whole idea of “Trumponomics” may be a fantasy and may also cause
US economy towards a deflation; i.e. higher inflation & stagnant growth/GDP
instead of a simple “Trumpflation” (higher inflation & higher growth).
After
initial days of euphoria, now some election campaigning day rhetoric may be
also coming back in the form of harder trade policies, imposition of additional
import duty in order to encourage “Made in USA” theme and anti China stance,
which may also invite similar retaliatory action from other countries, which in
turn may cause a wave of “trade war” along with the current “currency war”.
Eventually,
higher import duties, if implemented may also cause higher cost of US
manufactured products and incremental higher inflation, much beyond Fed’s
projection of 2% and may run towards 5% level within a year or two, which in
turn may force Fed to go for much more rapid rate hikes than projected in its
dot plots and as par some estimates, USD may gain almost 15% in that scenario
from the present level.
It’s
also unusual to have a direct co-relation of US EQ market with USD and its
usually an inverse co-relation (a strong USD is usually negative for US stocks,
considering not only for US exports, but also for overseas US corporates, which
has to report their earnings in USD, but actual earnings are happening in local
devalued currency). Thus, a cross currency headwinds for US corporates may be
one of the biggest risks under “Trumponomics”, if implemented in its actual
rhetoric.
As
par some reports, all else being equal and 5% surge in USD may translates
around 3% dips in earnings for US corporates and 0.5% in US GDP. After
“Trumpism”, dollar index already gained by 5% (DXY). USD gained significantly
against almost every other major G-10 currencies as well, which may affect
Q4FY16 earnings for the US corporates and affect the sentiment of the market,
despite perception of future corporate tax cuts and incremental capex by the
Govt.
Valuation
wise, for the SPX-500, the current TTM PE of around 25.62 may also be quite
expensive and in a bubble zone against its average PE of around 16. Current TTM
PE may also be highest since 2008 economic crisis.
For
SPX-500: 2263.79 (Spot)
Q3FY16
TTM EPS: 88.36
FY15
EPS: 88.43
FY14
EPS: 105.32
FY13
EPS: 103.93
FY12
EPS: 91.08
FY11
EPS: 93.14
FY10
EPS: 85.31
Average
EPS for last 5 years: 95.76 (FY10-FY-14)
Actual
growth for FY15 EPS: -16% (YOY)
FY15
EPS growth: -7.65% (from average of 95.76)
Mean
growth in FY15 EPS: (-) 11.82%
Against
this backdrop:
Projected
FY16 EPS: 117.56 (i.e. more than 26% growth from FY15)
Projected
FY17 EPS: 133.96 (i.e. around 12% growth from projected FY16)
Projected
FY18 EPS: 147.97 (i.e. around 10% growth from projected FY17)
Projected
FY16 EPS at around 118 may also be looking tough even on the back of buy back
of shares by various US corporates (courtesy Fed’s easy money policy), recent bounce
in oil & improvement in EPS of energy related shares and Q2FY16 softness in
USD.
But
the projected EPS growth for FY17-18 may be even tougher, considering recent
& future strength in USD, saturation in oil and base effect for the buyback
of shares. The projected US earnings growth of around 10-12% may be also looked
quite stretched on the back of tepid global growth, stress in China, various
geo-political risks in EU and trade barriers rhetoric by Trump, despite
proposed corporate tax cuts and huge Govt capex.
For
an economy, where GDP is growing around 3%, it may also be very tough for the
average US earnings (EBITDA) & EPS to grow above 12-15%; i.e. 4-5 times of
GDP growth. Top line (operating revenue) of US corporates may not be growing as
expected and the beat in EPS may be coming on the back of buy backs & other
non-operating income and tax benefits.
One
of the tailwinds for the US economy may be lack of any wage inflation and tepid
earnings growth. Although, the headline job numbers and employment data may be
looking great at this point of time, it also came on the back of lower
participation rate (which inflates the employment % rate) and lack of quality
jobs.
A
stronger USD and a hawkish Fed (higher dot plots) may ensure overall
incremental higher interest (finance cost) for the US economy in the coming
years and both US household debts (mortgage/auto/credit card/student loans) as
well as corporate debts/SME loans may be under immense pressure.
Having
said that, Fed’s actual action till 2018 may depend largely on trajectory of
“Trumponomics” & actual size & implementation time of the proposed
fiscal spending plan and depending upon that Fed may either hike 0.50-0.75%
both in 2017-18. Trump’s huge fiscal spending plan may also be largely
dependent on the “easy money” policy of ECB & BOJ; otherwise who will fund
the “Trumponomics” ?
But,
going by the present trend of nationalistic politics and trade protectionism,
especially after “Brexit” & “Trumpism”, EU politicians & policy makers
may be forced to abandon the “easy money policy” (QQE) gradually and may take
the path of higher fiscal spending (structural stimulus) for the benefit of
“real street” instead of relying too much on the monetary stimulus for the
benefit of “wall street”.
ECB,
BOJ and also PBOC & other G-10 countries may take less dovish monetary
stance and may also move towards gradual normalization in the coming months in
order to keep the policy parity (bond & interest rate differential) and USD
FX rate with their local currency at an equilibrium level, considering both
external & internal economics issues.

SPX
SPX

DJ

DJ
No comments:
Post a Comment