Friday, 31 July 2015

IRB Infra : Above 256-262 Could Fly To 290-315---Expected Infra & Mega Road Projects Push By Govt May Help

Technical Charts:


Technical Analysis:

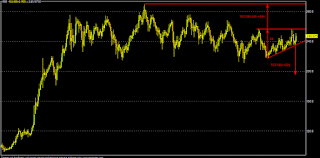
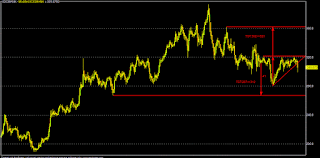
IRB (CMP: 249) has immediate support of around 242-238 & 233-226 zone. Sustain below 226, it may further fall to 220-210 area and consecutive closing below that, it could crash to 205-197-184 & 160 territory in the worst bear case scenario.

On the upside, sustaining above 242, immediate target may be 256 and consecutive closing above that 270-276 might be the target in short term, In the mid term term, only sustaining above 276, IRB may scale up to 290-300-315 area and consecutive closing above that 370 might be the target in the long term under bull case scenario (FY:16-18).

Technical Trading Levels (Positional):


SL</>2 FROM SLR


IRB CMP 249


T1 T2 T3 T4 T5 T6 T7 SLR
Strong > 238   242* 256-262* 270 276 290 300 315 <233
                     
Weak < 233   226 220 210* 205 197 184 160 >238
                     

Stock Analysis & Some Useful Inputs:

Yesterday IRB gave a technical break out (>242) amid some positive news flow that one of its subsidiary has raised debt of Rs.1400 cr to execute a mega road project awarded by NHAI (total cost of the project is around Rs.2290 cr as of now). The concession period for the project is 27 years.

Q4FY15 consolidated result/EPS of IRB was also above street estimates and looking ahead, Govt's massive push for infrastructure, mega road projects (@10000 km in the current FY), "Smart City" theme may revive this sector by H2FY16 (as widely expected).

Road, being the vital infra life line in "Modinomics & Shinning India", we may see actual progress of work in various stalled projects and also significant FDI in this sector in the coming days. Presently, our respected road minister (who is dedicated his life to mega high way projects) has assured the PMO to construct high ways @17-18 km/day and projected target is above 20 km/day by FY:16-17.

Certainly, under this circumstances, IRB may be one of the beneficiary of the expected push for mega road projects along with some other competitors like L&T.  

But, there are some serious risks in IRB, as CBI is investigating its Chairman in a 2012 case of murder of a RTI activist (who had exposed irregularities involving forged documents in a township project by IRB). This is as par old report & need to be verified further about the status of the case as of now.

Techno Funda Valuation As Par BG Metrics (Modified):

Current Median Valuation: 300

Projected Fair Valuation: 330-350-385 (FY:16-18)


SCRIP EPS(TTM) BV(Act)  P/E(AVG) LONG TERM SHORT TERM MEDIAN VALUE 200-DEMA 10-DEMA
IRB 15.45 117.31 24.6 298.54 302.84 300.69 234.5 241.3

IRB 18.62 129.05 24.6 327.74 332.46 330.10 234.5 241.3

IRB 20.74 142.15 24.6 345.89 350.87 348.38 234.5 241.3

IRB 25.1 156.55 24.6 380.52 386.00 383.26 234.5 241.3


Thursday, 30 July 2015

L&T Finance: Moving Fast Towards Consumer Oriented Lending From Commercial Space--67-65 Might Be A Good Buying Zone For 97-115


Technical Analysis: 


Looking at the chart,  L&TFH (CMP:68) has immediate support of around 67-65 zone and sustain below 65, it could fall to 62-61 & 59 area. Only consecutive closing below 59, it may further fall towards 54-50-45-40-30 territory in the worst bear case scenario.


On the upside, sustaining above 67, immediate target may be 72-75-78. Only consecutive closing above 78, L&TFH might target 83-88 & 92-97 in the near term. In the long term, sustaining above 97, it may scale up to 105-110-120-130 under the bull case scenario (FY:16-18).

Technical Trading Levels (Positional): 


SL</>1 FROM SLR


L&TFH CMP 68


T1 T2 T3 T4 T5 T6 T7 SLR
Strong > 67 72 75-78* 83 88 92 97* 105-115 <65
Weak < 65 61 59* 54 50 45 40* 30 >67


Stock Analysis & some useful inputs:


L&TFH is now concentrating more on retail consumer oriented loan and focusing on financing tractors, two-wheelers, microfnance, home loans & SMEs.  As a business strategy, for better NIM and to combat overall industrial economic slowdown, it is gradually shifting from wholesale business (financing commercial equipments & vehicles-CE/CV) towards consumer (retail) finance need. As the economy will stimulate (as expected from H2FY16 onwards), it will expand its wholesale finance as par available & profitable opportunity. Also, the proposed 7-th pay commission might recommend an average of 30-40% salary hike with arrears by Jan'16 and that will also stimulate overall consumer demand (multiple two/four wheelers/home loans/electronic goods etc) from so called middle class Govt. employees. Although such astronomical pay hike may ignite further wage inflation and could also strain Govt's financial discipline, over all this may be good for our economy to stimulate demand (at least for short term).


Its Q1 result is inline/above market estimates mainly due to steady income/stable loan growth along with controlled operating expenses amid increasing digitization. Overall loan was growing by around 21% and disbursements by a healthy 37% due to more demand from 2W, housing, microfinance in retail segments and operational projects in wholesale segment.

Asset quality deteriorated during Q1 to some extent on account of higher delinquencies in farm portfolio (may be due to unseasonal rains to some areas). The company also shifted the NPA recognition system from earlier 180 days to 150 days and that is also responsible for sequentially higher gross NPA to 3.05% from 2.25%. Also tractor finance is highly susceptible to NPA & may pose some headwinds for the company in a drought year.

Looking ahead, the management is somehow cautious in its guidance. Although it sees improved sentiments & confidence among borrowers amid various steps initiated by the Govt, the overall economic or operating environment is still sluggish and due to lack of robust order flows and stretched balance sheet, certain restructured assets is showing continuous levels of stress. But good monsoon & its distribution this time (at least better than expected) may help the NBFC space in general & L&TFH might be one of them. 

L&TFH came to the lime light last year, when there was talk of granting banking licensees to various corporate groups and L&T was one of them, but it lost out as the whole phenomenon was proved to be an non-event later.

But in future, we could see significant consolidations among various PSU banks & smaller private ones due to huge unsustainable NPAs and significantly higher regulatory requirement of capital (as par Basel-III norms), So, it might not be feasible to have small sized banks amid starved of working capital and consolidations or new full banking license will be the game changer in the banking space apart from growth opportunity in an organic or inorganic way. RBI may also consider to open the tap of new banking license in the days ahead & L&TFH, being a well respected group, having not so much controversy, might be a well deserved candidate as well.    

Being a NBFC of the L&T group, having considerable financial muscle, robust professional management and a trusted brand & reputations, it might emerge a considerable strong player in the financing space, specially in urban & rural India in the days ahead.


L&T owns around 73% of L&TFH. To meet the regulatory requirement and also for requirement of additional capital, its actively scouting for stake sale and as par various reports, a US based PE fund (Warburg Pincus) is in active talks to take 25% of  L&TFH (although the management is vehemently denied it as usual as "pure speculation" because of various regulatory compliance). 


Techno Funda Valuation As Par BG Metrics (Modified):


Current median Valuation may be around 88 and projected fair values might be around 97-105-115 (FY:16-18) in the current market parameters.


SCRIP EPS(TTM) BV(Act)  P/E(AVG) LONG TERM SHORT TERM MEDIAN VALUE 200-DEMA 10-DEMA
L&TFH 4.42 38.83 24.12 84.52 86.66 85.59 67 70.45

L&TFH 5.22 40.8 24.12 91.85 94.18 93.01 67 70.45


L&TFH 6.4 42.9 24.12 101.70 104.28 102.99 67 70.45


L&TFH 7.95 45.15 24.12 113.35 116.23 114.79 67 70.45


Wednesday, 29 July 2015

Bharti Airtel:Fine Tuning Its Africa Operations--Blw 405-400 May Fall To 390-370 Zone, Where It Could Find Good Buying Support For A TGT Of 455


Technically, Bharti (CMP:410) has immediate support of 405-400 zone and sustain below that it could fall to 390-380-370 area. Consecutive closing below 370*, it may further fall to 359-350-338* & 326-317-310-290-279  territory in the worst bear case scenario.


On the upside, sustain above 405, Bharti may immediately target 412-419-426. Only consecutive closing above 426-430, it may scale 438-443-455 in near term. In the mid to long term, sustaining above 455, Bharti could target 465-475-485 & 500-510-535 & 565-600 under bullish case scenario (FY:16-18).

Bottom Line:Technical Trading Levels (Positional)


SL</>5 FROM SLR


BHARTI CMP 410


T1 T2 T3 T4 T5 T6 T7 SLR
Strong > 405 412-419 426-430* 438-443 452-455* 465-475 485-490 500-535 <400
Weak < 400 390 380 370* 359-350 338* 326 317-279 >405

Bharti is presently deleveraging (selling & exiting) its unprofitable African business except better markets like in Kenya and Nigeria to reduce its huge balance sheet debt of around Rs.62200 Cr. The company will concentrate more now on India (specially in 3G/4G) as our country has now better telecom regulatory environment, comparatively less competition than few years ago due to growing consolidation & huge cost of operations (where only players having deep pocket could survive in future) and stable telecom tariff. Also there will be huge opportunity in data market as India is now world's fastest growing smart phone market and also there will be "Digital India" initiatives. Now-a-days, people are increasingly talking less over mobile and OTT IM like WA is the preferred way for seamless communications, which is consuming more data. 

But some headwinds might come from R-JIO in terms of tariff & market share etc in future.


As par BG metrics, current median valuation of Bharti Airtel may be around 445 and its projected fair valuation might be around 475-530-600 (FY:16-18 On standalone basis).


SCRIP EPS(TTM) BV(Act)  P/E(AVG) LONG TERM SHORT TERM MEDIAN VALUE 200-DEMA 10-DEMA
BHARTIARTL 33.02 166.93 14.29 430.46 449.68 440.07 392.7 428.54


BHARTIARTL 38.05 190.3 14.29 462.09 482.71 472.40 392.7 428.54


BHARTIARTL 47.5 217 14.29 516.29 539.33 527.81 392.7 428.54


BHARTIARTL 59.5 250 14.29 577.84 603.63 590.73 392.7 428.54


To be continued for some more useful inputs----

Tuesday, 28 July 2015

Nifty & Bank Nifty: In A Bull Market, Prices Goes Up In An Elevator While Goes Down In An Escalator-- Watch 8326-8273 & 18150 For Any Dead Cat Bounce


Technically, NF (LTP:8370; SGX : 8330) has immediate support of around 8343-8326-8290-8273-8250 zone and sustain below that there is not so much support until 8200-8180-8150-8130 area. Consecutive closing below 8130, NF may further fall to 8060-8038-8000 & 7930-7880 in the near term under bear case scenario.

On the upside, NF has to sustain at least over 8380-8410 zone for any meaningful dead cat bounce towards 8450-8495-8515-8550 area. Only consecutive closing above 8550, NF will gain more strength for a rally up to 8582-8605-8653-8672* & 8685-8700-8760* zone in the bullish case scenario.

Bottom Line (Technical Trading Levels):


Gap Up/Dw (Indicative)


SGX NIFTY 8330 -40


        NF-JULY LTP     8370
                 
                 
  SL (+/-) 10 POINTS FROM SLR            
                 
  Intraday Swing  Trader            
      T1 T2 T3 T4 T5 SLR
Strong > 8410   8450-95* 8515-50 8582-8605 8653-72* 8700-60* <8390
                 
Weak < 8390   8343-26 8290-73* 8250-25 8200-180 8150-30 >8410


FOR  Conservative Positional Trader


      T1 T2 T3 T4 T5 SLR
Strong > 8410   8495* 8550 8605 8672* 8760* <8390
                 
Weak < 8390   8326* 8250* 8180 8130 8038* >8410
                 

Similarly, for BNF it is:


BNF-JULY LTP 18268


SL=+/-  25 POINTS FROM SLR


      T1 T2 T3 T4 T5 SLR
Strong > 18350   18460 18581* 18660 18800 19016 <18300
                 
Weak < 18300   18150 18020* 17905 17850 17725-590 >18350


Our market yesterday corrected a lot amid China & global sell off and further aided by our domestic jitters like P-Note/SIT issue. There are also excuses of weak corporate earnings, parliament logjam, JP group bad loan to certain banks etc.

In China, there was an rumour that CSRC might exit the stock stabilization fund and repaying the interbank loan, which was later vehemently denied by the authority. In any way, a meaningful correction in China after one year unabated rally of around 140% is quite normal in any stock market, but the Chinese authority is going in full throttle in a desperate way to stabilize the market to behave an orderly way, so that rural China (retail clients) is not washed away completely. But, the market is very nervous about the Chinese way of controlling it ("malicious short sellers of Chinese stocks may be in deep trouble, if caught red handed!!")----is China is trying to hide something more suspicious that we don't know ? Basically, China market is now a classic tug of war between FII(s) & the China authority, but ultimately no FII will try to fight against a powerful central bank like PBOC for long.

At a glance, China-A-50 has now immediate strong technical support zone of around 10300-200 zone followed by 10000-9650 area. An orderly Chinese stock market is necessary for overall China economy & global stability, other wise a severe contagion effect could spread all over the global market, including India.

Apart from China, all eyes will be on Fed tomorrow for their FOMC minutes. Most probably, Fed will be in side line till Sep'15 and now there is around 40% probability by OIS market (Fed Fund Rate) for a possible lift off in Dec'15 with various caveats. Strong USD & low inflation along with some global jitters (like China hard landing, fragile EU/Greece etc) might be helpful for Fed to maintain its dovish stance going forward. Market will also keenly watch US core GDP on Thursday for an idea about its real economy.

For our Nifty, we might be in an extended range of 7900-8700 in the near term with different types of news flow & real corporate earnings. There is a real possibility that GST might be passed in some form or other in this monsoon session of Parliament and that may help the market in the short term. RBI might oblige only in Oct (Dewali Gift !!) and expect overall cut of 0.50% till March-April'16.


Monday, 27 July 2015

ICICI Bk: Ahead Of Q1 Result---TGT 370 Only Abv 325, Otherwise May Fall To 280-265


Technically, ICICI (CMP: 301), has to sustain over 306 for an immediate target of 312-317 & 321-325-331. In the near term, only consecutive closing above 325-331 zone, it may target 340-344-351-356-362-370 zone and sustaining above that, 395-410-435 might be the target in mid to long term under bullish case scenario.

On the downside, sustaining below 299, ICICI may fall to 293-288-284-279 area in the immediate to short term. Consecutive closing below 279, it could further fall to 265 and sustaining below that, 254-250-236-233 & 206-199-188 might be the target in worst bear case scenario.

In brief, ICICI Bk might be in the broad range of 265-280-325*-340-370 in the near term.

Bottom Line: Technical Trading Levels (Positional)


SL</>3 FROM SLR


ICICI CMP 301


T1 T2 T3 T4 T5 T6 T7 SLR
Strong > 306   312-317 321-325* 331-340* 344-351 356-362 370-395 410-435 <299
                     
Weak < 299   293-288 284-279* 265* 254-250 236-233 206-199 188-175 >306
                     

ICICI scrip was under pressure for the last few days & broke key support level of 312 amid concern over debt exposoure (Rs.13000 cr approx) to bewildered JP group as CARE downgrades its (JP) debt profile. Also SBI & IDBI has considerable exposoure to this group for around Rs.8000 & 6500 Cr.

Some good news is that, most of these debt exposoure of JP Gr (debt nearly Rs.1 lk cr!! including JP power) has been backed by hard assets/some co-laterals unlike King Fisher. Thus, there may be some cash-flow mismatch, ultimate write downs might be lower. Still there will be great concern by the market for this debt laden JP & certain other over leveraged groups as the whole banking industry is reeling (specially PSBS) under huge stressed assets of over Rs.4 lakh cr and going ahead, liquidity might be a concern, when real industrial credit demand expected to take off in H2FY16.

As par BG metrics, current median valuation of ICICI Bk may be around 345 and projected fair valuations might be around 370-405-450 under the current market parameters (FY:16-18).


SCRIP EPS(TTM) BV(Act)  P/E(AVG) LONG TERM SHORT TERM MEDIAN VALUE 200-DEMA 10-DEMA
ICICIBANK 19.25 126.19 19.77 345.69 345.09 345.39 314 312.92

 
ICICIBANK 22.12 138.2 19.77 370.56 369.92 370.24 314 312.92

 
ICICIBANK 26.34 151.35 19.77 404.37 403.67 404.02 314 312.92
 
ICICIBANK 31.35 165.75 19.77 441.15 440.39 440.77 314 312.92