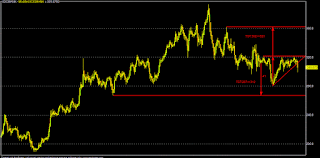
Technically, ICICI (CMP: 301), has to sustain over 306 for an immediate target of 312-317 & 321-325-331. In the near term, only consecutive closing above 325-331 zone, it may target 340-344-351-356-362-370 zone and sustaining above that, 395-410-435 might be the target in mid to long term under bullish case scenario.
On the downside, sustaining below 299, ICICI may fall to 293-288-284-279 area in the immediate to short term. Consecutive closing below 279, it could further fall to 265 and sustaining below that, 254-250-236-233 & 206-199-188 might be the target in worst bear case scenario.
In brief, ICICI Bk might be in the broad range of 265-280-325*-340-370 in the near term.
Bottom Line: Technical Trading Levels (Positional)
| SL</>3 | FROM SLR | |||||||||
| ICICI | CMP | 301 | ||||||||
| T1 | T2 | T3 | T4 | T5 | T6 | T7 | SLR | |||
| Strong > | 306 | 312-317 | 321-325* | 331-340* | 344-351 | 356-362 | 370-395 | 410-435 | <299 | |
| Weak < | 299 | 293-288 | 284-279* | 265* | 254-250 | 236-233 | 206-199 | 188-175 | >306 | |
ICICI scrip was under pressure for the last few days & broke key support level of 312 amid concern over debt exposoure (Rs.13000 cr approx) to bewildered JP group as CARE downgrades its (JP) debt profile. Also SBI & IDBI has considerable exposoure to this group for around Rs.8000 & 6500 Cr.
Some good news is that, most of these debt exposoure of JP Gr (debt nearly Rs.1 lk cr!! including JP power) has been backed by hard assets/some co-laterals unlike King Fisher. Thus, there may be some cash-flow mismatch, ultimate write downs might be lower. Still there will be great concern by the market for this debt laden JP & certain other over leveraged groups as the whole banking industry is reeling (specially PSBS) under huge stressed assets of over Rs.4 lakh cr and going ahead, liquidity might be a concern, when real industrial credit demand expected to take off in H2FY16.
As par BG metrics, current median valuation of ICICI Bk may be around 345 and projected fair valuations might be around 370-405-450 under the current market parameters (FY:16-18).
| SCRIP | EPS(TTM) | BV(Act) | P/E(AVG) | LONG TERM | SHORT TERM | MEDIAN VALUE | 200-DEMA | 10-DEMA |
| ICICIBANK | 19.25 | 126.19 | 19.77 | 345.69 | 345.09 | 345.39 | 314 | 312.92 |
| ICICIBANK | 22.12 | 138.2 | 19.77 | 370.56 | 369.92 | 370.24 | 314 | 312.92 |
| ICICIBANK | 26.34 | 151.35 | 19.77 | 404.37 | 403.67 | 404.02 | 314 | 312.92 |
| ICICIBANK | 31.35 | 165.75 | 19.77 | 441.15 | 440.39 | 440.77 | 314 | 312.92 |


No comments:
Post a Comment